Measuring the performance of your frontend application
The performance of an application is critical to its success. Having a fast application will lead to a better user experience and to an increased adoption rate.
But what does it mean that an application is fast? And how does one measure the performance of a single page application?
In this article we are going to focus on two main aspects:
- Initial load time
- Subsequent runtime performance
Let’s take a look at these in detail.
Initial load time
The initial load of an application consists of downloading all the necessary files to the client machine (HTML, CSS, Javascript etc) and initializing the application code.
In order to assess the loading speed of an application, we can use the Chrome DevTools “Network” tab to see detailed information about the number of files requested from the backend and the total load time. To open the DevTools you can click Ctrl + Shift + I on any website.
Here is the recording for loading a LinkedIn profile:
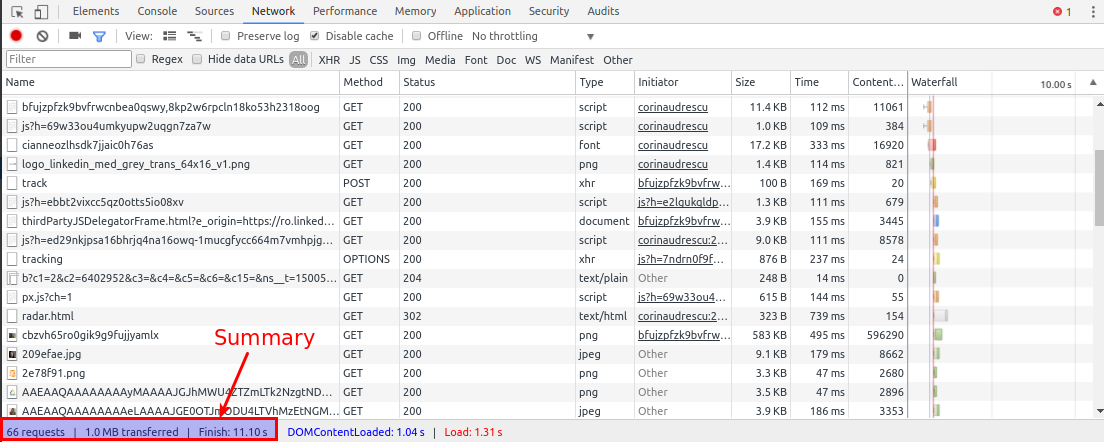
In the bottom left area, you can see a quick summary of the page load:
- The total number of requests that were made
- The total size of the files downloaded from the server (or other services)
- The total duration of the initial page load
It is important to make sure you download to the client just the files that you need and that you optimize the size and the number of the files you download.
Some common strategies for improving the load times are:
- Concatenating JavaScript files together and respectively CSS files together, to make fewer requests to the backend
- Minimize and obfuscate the JavaScript code to decrease file size
- Compress images and optimize web fonts
- Enable gzipping on the server side
Runtime performance
Even if the application loads fast initially, it is possible that on some screens you notice some “lag” when clicking on something or performing some specific action.
This can be profiled by using the Chrome DevTools “Performance” tab.
You need to first define what the series of actions you want to profile is and then “Record” it.
For example, if you have a button that when pressed opens a dialog and you notice the dialog appears rather slow, you could record this as follows:
- Open the application and navigate to the page with the button
- Open the DevTools and click “Record” in the “Performance” tab
- Click the button and wait for the Dialog to load
- Click the “Stop recording” button
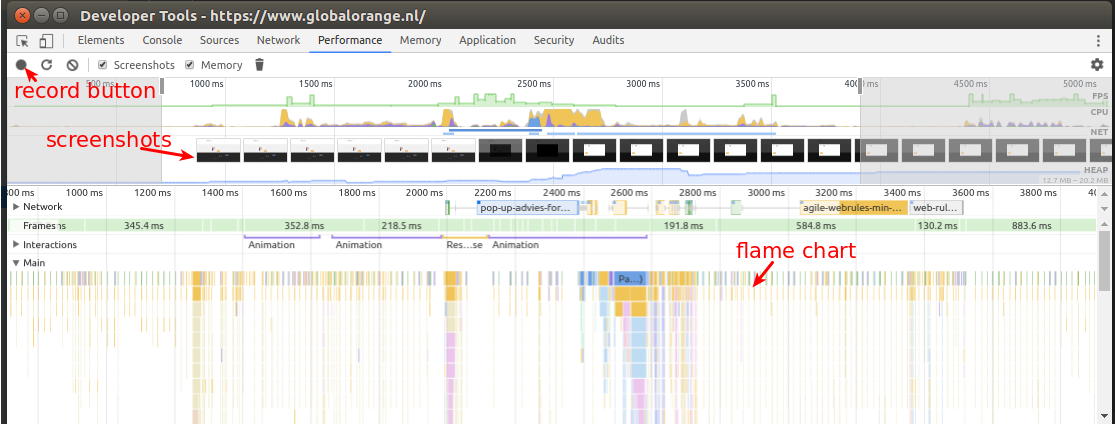
This view can seem daunting at first, so let’s break it down a bit:
- What you see represents a timeline of what happened since the button was first clicked and until the dialog was shown
- In the “Screenshots” lane you can see a “Filmstrip” of the steps the page went through as the dialog was shown; Normally, you would not be able to notice all the intermediate steps of a certain action, but this makes it very easy to notice after how many milliseconds somethings was shown
- Other lanes displayed are for Frames per second (FPS), CPU, network traffic (NET) and memory usage (HEAP)
- At the bottom you can see a “Flame Chart” showing what actions the browser was performing. The width of an action represents its duration, so the longer a segment, the longer it took; The height of a segment in the flame chart represents the call stack - so what other functions or actions were triggered
With this view it is definitely more tricky to immediately identify the bottlenecks, but there are some things you should look for:
- In the FPS and CPU lanes, look for spikes; What is taking a long time to render or load? Correlate this with the flame chart below to identify the functions which might be the culprit
- Look for the wider segments in the flame chart, as these have the highest duration; does anything pop out as taking longer than expected?
- Look at the code that was executed before the wide segments; What triggered a specific piece of code?
Once you identified a potential problem area, you can change the code and then record the exact series of actions and compare the timeline of the updated code. Do you still see the bottlenecks?
You can learn more about the “Performance” tab in the official documentation here: https://developers.google.com/web/tools/chrome-devtools/evaluate-performance/reference.
Always measure before you improve
Measuring the performance of your application is a process that takes time and needs to be done continuously. However, you should not jump into any optimization before you have confirmed which part of the code is indeed the culprit. Otherwise, you might end up actually decreasing the performance.
Did you ever have to investigate a performance issue in your app? How did you approach it?
Let me know in the comments below.
Comments ()