How to check if your component rerendered - and why!
If you're like me, you're probably using console.log a lot to check the React rendering lifecycle of your components 😅 When it rerendered, why - was it a setState or something else ?! - or even just to get a better handle of React fundamentals.
This can work fine at the beginning - but what if you want to answer bigger questions about your app - like whether using Context has an impact on the performance of your app? Or simply, what if you're tired of scrolling through tens of console.logs figuring out what executed when?
Then it's time to use the React DevTools! Not only do they allow you to visually see what components rerender, but you can also investigate what caused each rerender and easily spot what components are taking longest to render.
Using React DevTools to highlight what components rerendered
There's a checkbox well hidden in the React DevTools settings that allows you to visually highlight the components that rerendered.
To enable it, go to "Profiler" >> click the "Cog wheel" on the right side of the top bar >> "General" tab >> Check the "Highlight updates when components render." checkbox.
Then just interact with your app as usual and watch it all light up ✨
Using React DevTools to find out the cause of a rerender
Now that you can see your component rerendered, the next question is .. why?
There's a very handy tooltip that shows up when hovering over a component in the "Flamegraph", that shows the reason for a render under the "Why did this render?" heading.
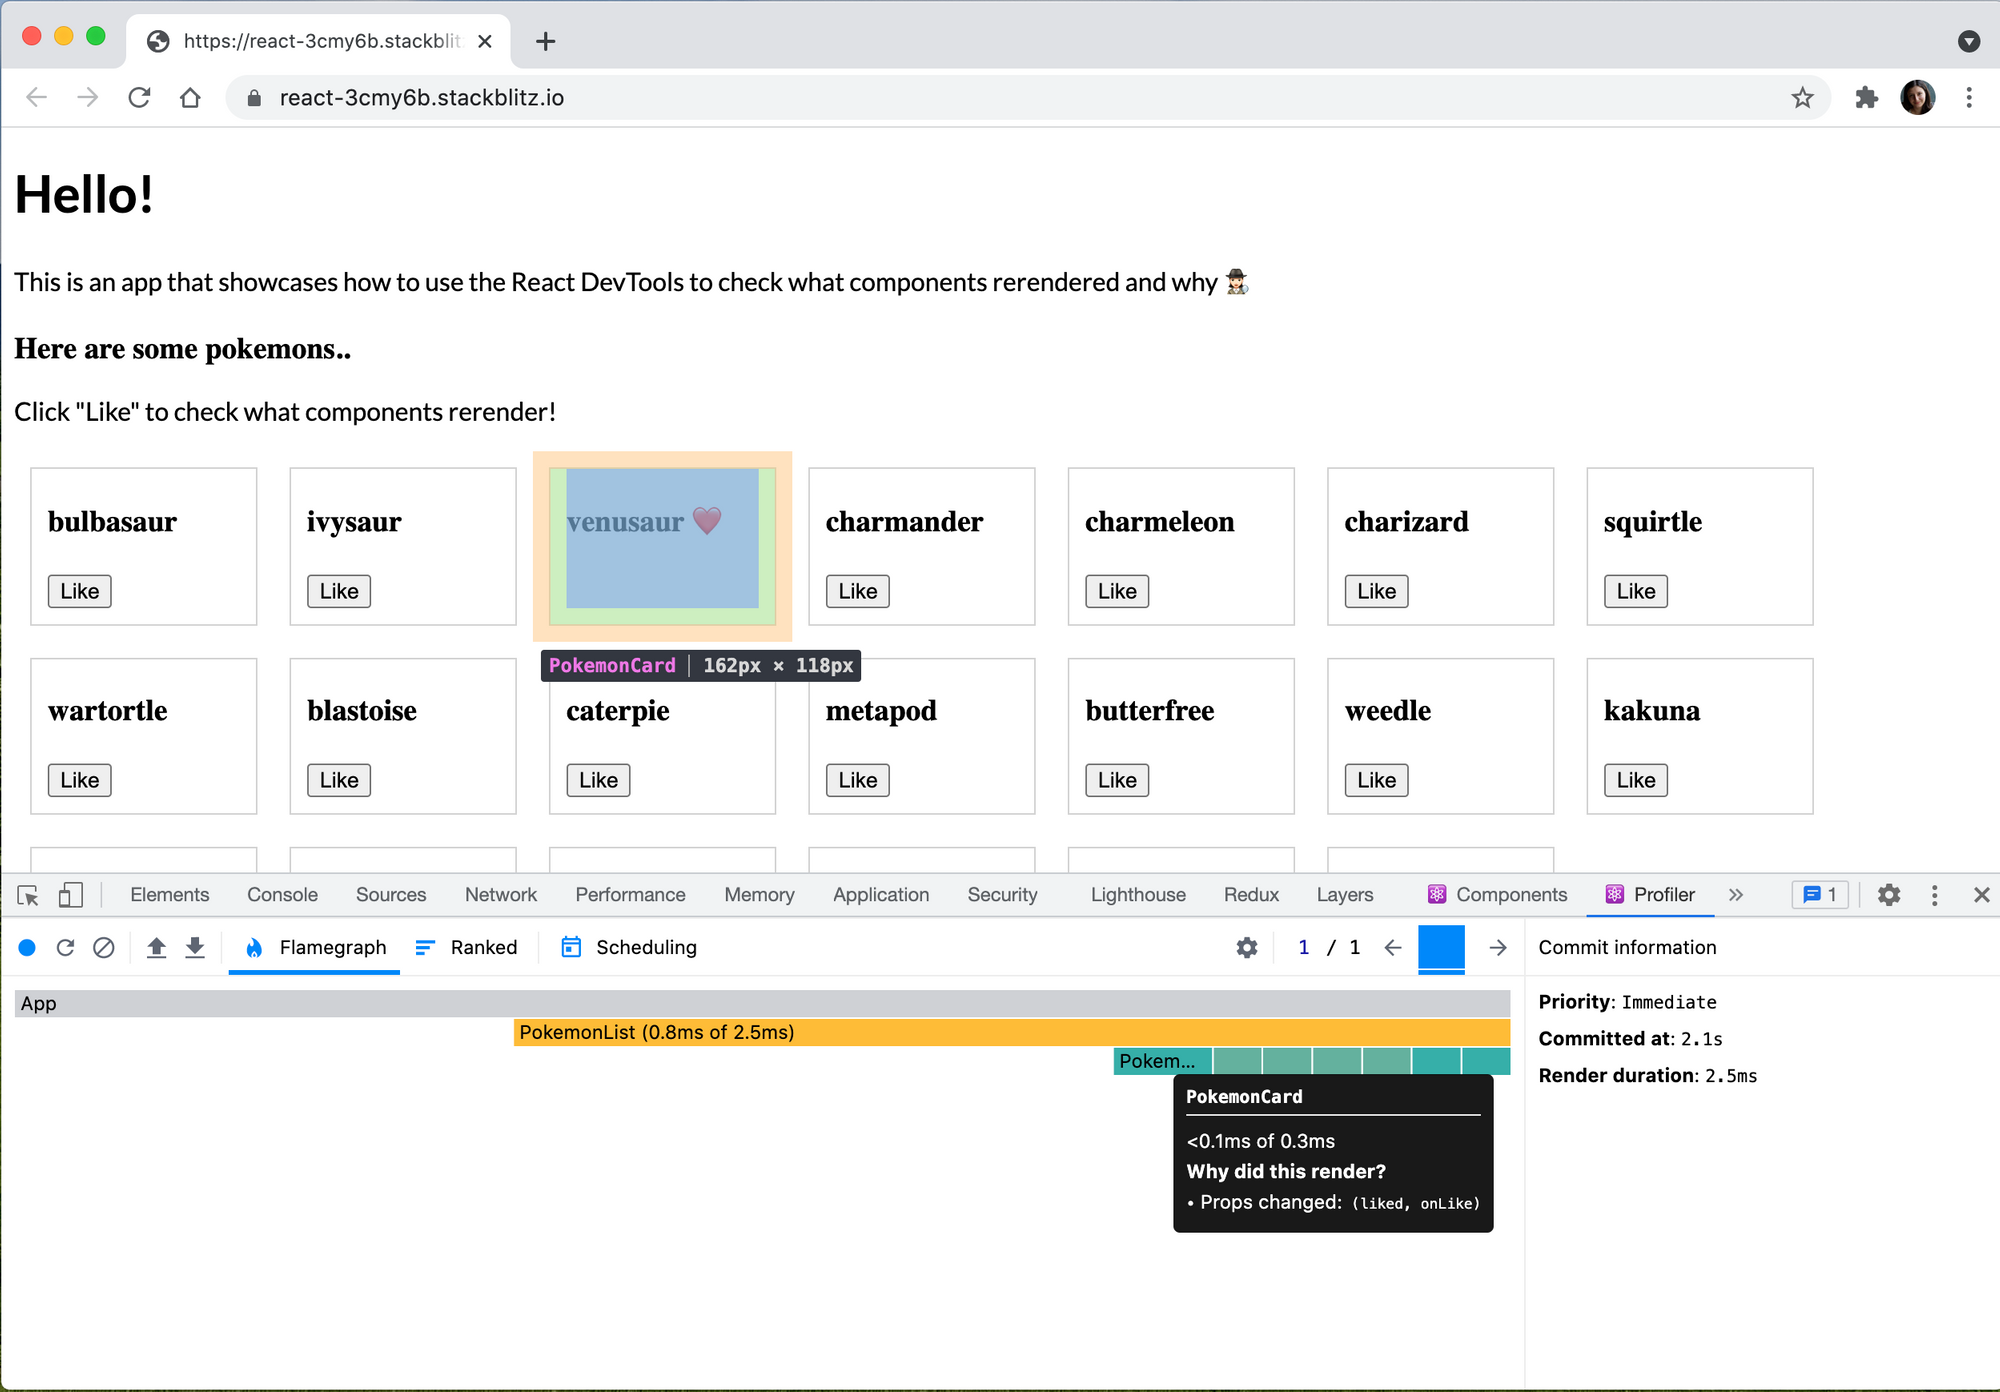
To see this, you need to record a "Profiler" session.
For example, if you your component re-renders after you click a button, you can click record to start profiling, click the button in question, then stop profiling and see the details of what happened when the button was clicked.
Here's how to read the profiler output:
- In the top right you have the number of React commits - each bar represents a moment when the React component tree changed and a change was commited to the DOM
- The "Flamegraph" shows the component tree and what changed - "grey" means the component did not rerender
Hovering over each component will reveal why it rendered in the "Why did this render?" subheading.
Possible values you can expect to see as reasons for a component rerendering:
- "This is the first time the component rendered."
- "Context changed"
- "Hooks changed"
- "Props changed"
- "State changed"
- "The parent component rendered."
You'll notice that sometimes the reason is not very detailed - simply saying "hook changed" instead of the details of what hooked changed. This is expected and it happens because sometimes the DevTools simply does not have access to that information or because it would be too slow to retrieve.
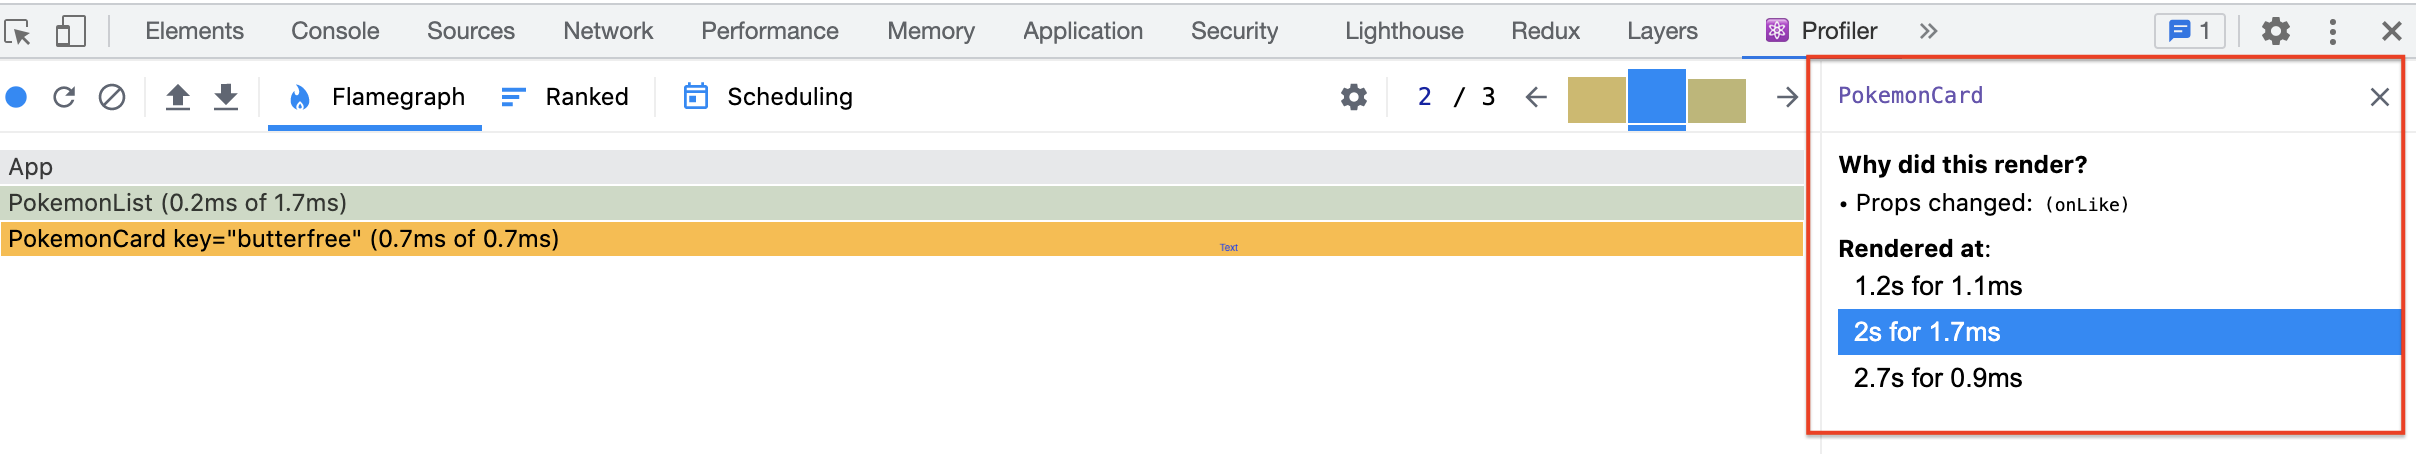
When you click a component in the "Flamegraph", the right sidebar will update to show all renders of that component instance and why they happened:
Bonus tip: See at a glance what components took longest to render
It took me a while to figure this one out, but the colors in the "Flamegraph" actually have a meaning: "cool" colors - like shades of blue - signify the component took little time to render compared with everything else and "warm" colors - like orange and red - signify the component took a longer time to render 😀
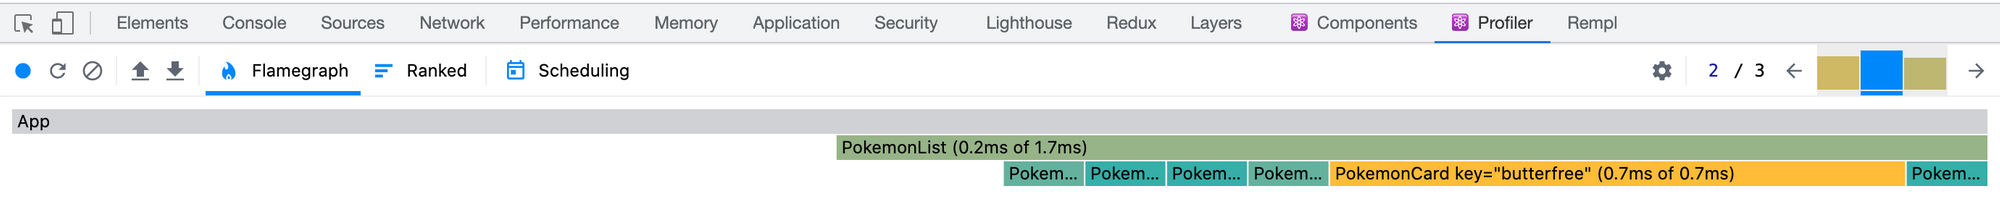
Notice how I just said "more time" or "less time" to render - that's because what is slow or fast is relative to your specific app and total render time. So it could be that a "yellow" component rerendered very fast if it's part of a simple component tree, or for a "blue" component to actually take a very long time to render if the whole app is very slow.
Bonus tip: See what DOM changes actually happened
Even if a component rerendered, it doesn't mean that any changes were actually applied to the DOM - it could be that the output of render was the same as before, in which case React does nothing. But how can you check? How can you visually see what DOM parts were rerendered?
The Chrome DevTools have a very useful setting for this - "Paint flashing". This will highlight all elements of a page that were "repainted". To enable it, you need to click the "Settings" menu, then "More settings" and then "Rendering" and check the "Enable paint flashing" checkbox.
Try it out for yourself!
You can find the sample app used for this blog post at https://stackblitz.com/edit/react-3cmy6b. (Make sure to click "Open in New Window" in the top bar in order to see the app outside of the StackBlitz environment, which makes it easier to profile. )
Can you figure out why all "cards" render when just one is clicked? And moreover, can you fix it? 😀
Fork the code and share your solution in the comments below!
Comments ()